


Catchment context

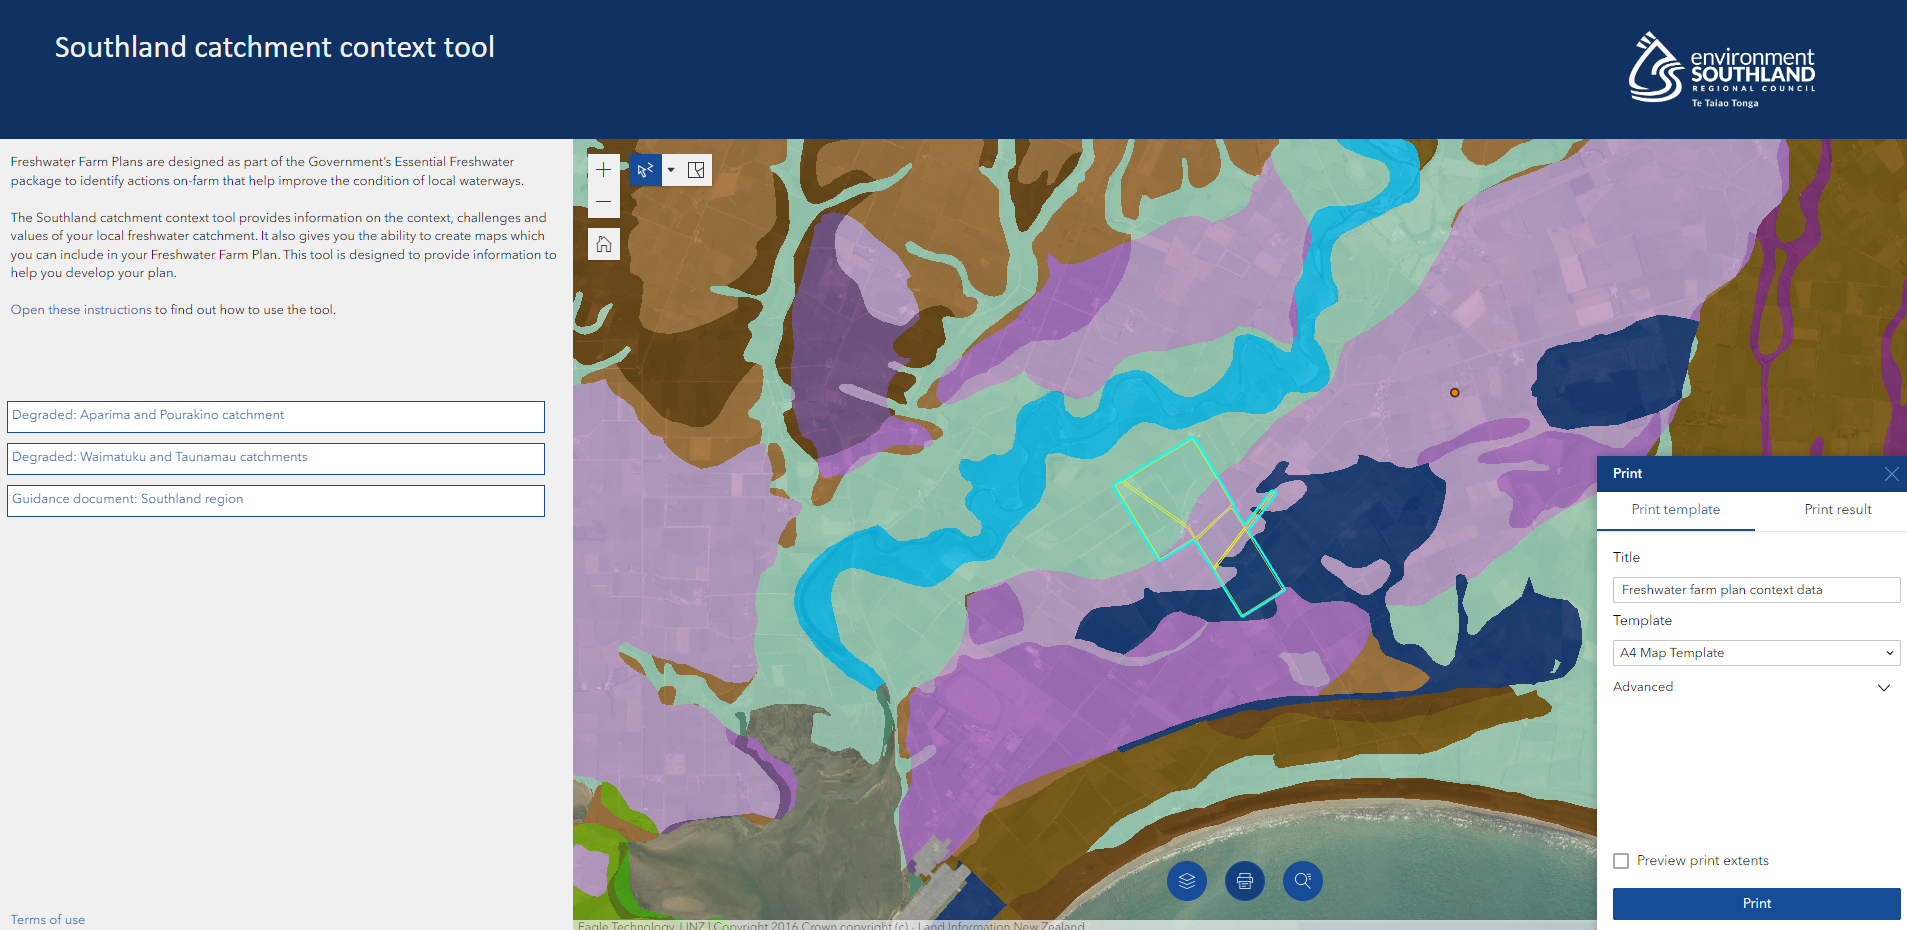
I can’t access the tool from my phone or tablet.
The tool works best from a desktop environment, please access it from a desktop/laptop computer and try again.
The page appears but the map doesn’t load.
This can occur with older internet browser versions. Ensure your browser version is current, or try switching to a different one (e.g. switch from Google Chrome to Microsoft Edge, or vice versa).
My farm has separate areas that aren’t contiguous, how do I select them all?
The tool only permits the selection of adjacent titles (this is a software restriction we cannot change, not a design choice) so you cannot select titles that are not adjacent at the same time. Select all adjacent titles in one area and download the reports and generate maps, then clear the selection and select the next set of adjacent titles. If the report titles are the same (i.e. they are in the same catchment[s]), then you won’t need to download them again, just generate maps for that area too. This will also ensure the maps appear at a larger scale to make them easier to see.
The imagery doesn’t show recent changes to the farm.
New aerial imagery has been captured and will be added to the tool as soon as it is available.
Why is there an orange dot appearing on my maps?
The line selection tool puts an orange dot where the mouse pointer sits on your screen. This will show on your maps when you produce them. To avoid this, just click once on the selection tool button again to remove the dark blue highlight and make it inactive, then produce your maps.


