


Murihiku Southland Climate Change Impact Assessment Report
What is climate?
Everything is connected. To understand the link between extreme weather and climate change, we need to first understand Earth’s systems. If we make a change in one part, there will be an impact somewhere else. Our climate is always changing as natural and human activity unfold.
Human activity, especially since the early 1950s, has resulted in an increase in the concentration of heat trapping gases, resulting in more heat being trapped. This changes the Earth’s climate. Because all Earth’s systems are integrated and interdependent, this change in the atmosphere has wide ranging impacts, including on the weather.
Is there a difference between extreme weather and a changing climate?
Weather refers to day-to-day conditions, whereas describes the typical weather conditions over a long period of time. Climate is what you expect, weather is what you get.
‘Extreme weather’ refers to unexpected, unusual, severe, or unseasonal weather; weather at the extremes of what we would normally expect. These events may happen on a single day, or they may occur over a long period of time.
As our climate changes, science tells us that extreme weather events (such as droughts and extreme rainfall) will increase in frequency and intensity in many places.
Why did we commission the report?
The report was commissioned to provide updated projections on the 2018 climate change impact assessment using improved, higher resolution models. This report uses projections based on Shared Socioeconomic Pathways. These factor socioeconomic responses into the projected emissions scenarios, providing increased confidence in the projections. Another key incentive for the update was the addition of hydrological high flow metrics to improve our planning around flood mitigation.
Environment Southland has a legal obligation to: Consider climate change in planning and resource decisions; Manage climate-related natural hazards; Integrate national climate policy (adaptation and emissions plans) into regional plans; Regulate environmental activities affected by climate change; Manage organisational risks (e.g., liability) and assets Inform investment decisions in the region
What are the three emissions scenarios modelled in the report?
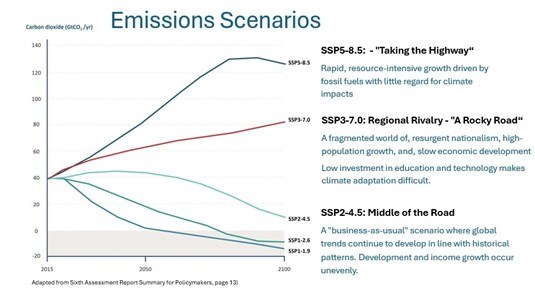
What are the three emissions scenarios modelled in the report?
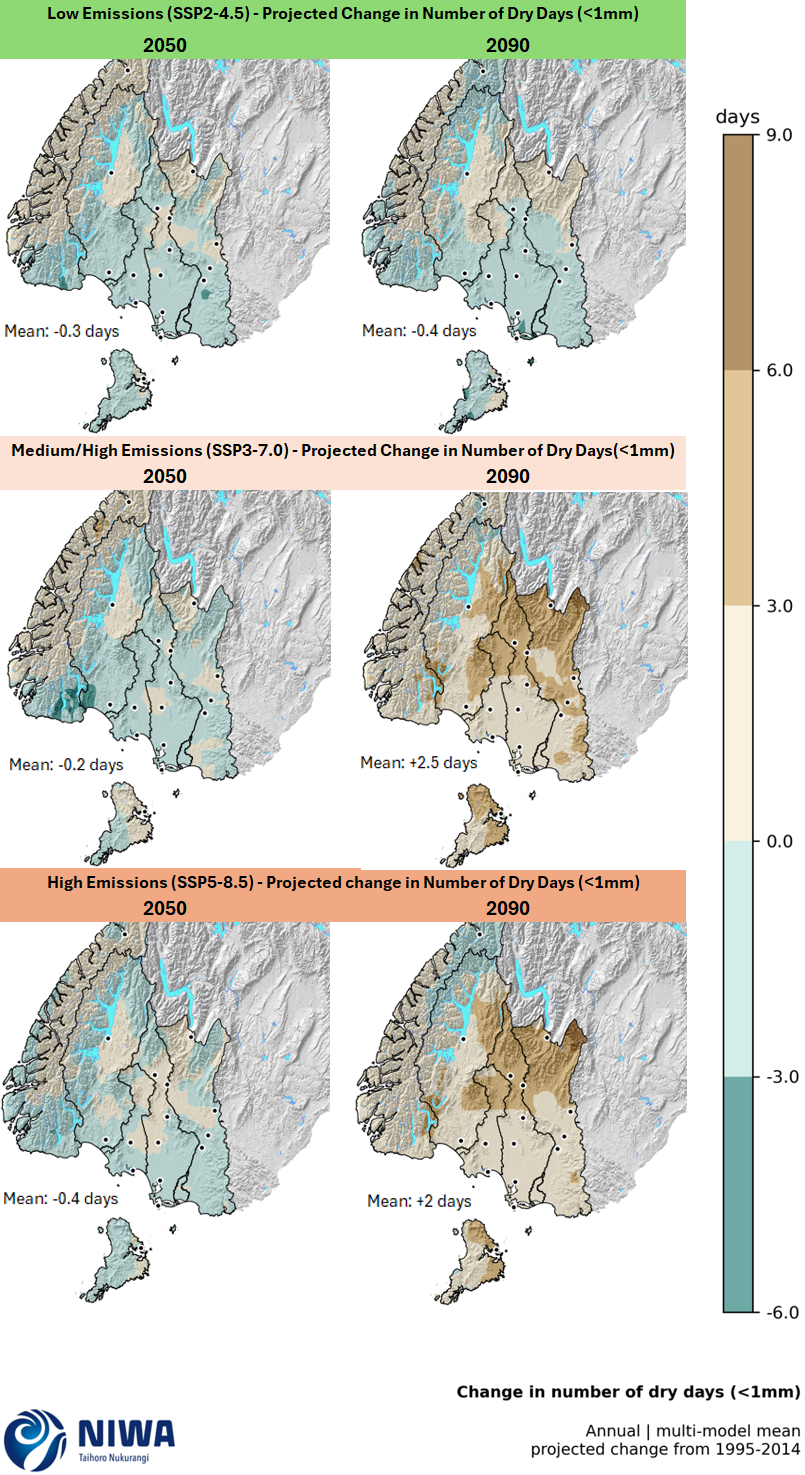
The climate projections used in this report are derived from the 6th Coupled Model Intercomparison Project (CMIP6), which incorporates several significant scientific and modelling advances. Climate change projections are generated for three emissions scenarios: SSP2-4.5, SSP3-7.0 and SSP5-8.5. The hydrological modelling builds on the Deep South National Science Challenge project ‘Climate change impact on national hydrology’ The modelling methodology follows recommendations from the Ministry for the Environment. Future projections of New Zealand’s Earth System Model were used to quantify sea surface temperatures, marine heatwaves and ocean acidification. Two tide-gauge records were analysed: the Port of Bluff gauge operated by South Port and archived by LINZ, and the Stead Street Bridge gauge operated by Environment Southland. Both records span more than 30 years, providing a robust basis for assessing mean sea-level trends, tidal characteristics, and extreme storm-tide levels. A wide range of data sets across the different climate aspects have been used in the modelling (more information is available in the report itself).
With so much uncertainty is there any point planning/taking action?
The trends are clear and the discrepancies are minor. It’s undisputed that our climate is changing and that we need to be planning to adapt to it. The information in this report will be crucial to regional planning.
How does scientific understanding about climate change grow?
The current scientific understanding of climate change has been built upon observations, models and theory that are continually updated as new evidence is reviewed and incorporated. For decades, scientists have been observing the climate system and building models to help us understand both historical climate and potential future climate scenarios. To provide the world with a clear understanding of the consensus view, the Intergovernmental Panel on Climate Change (IPCC) provides governments at all levels with scientific information they can use to develop policies and responses.
What does this mean for emergency management in Southland?
Wetter weather could potentially increase landslide risks. Environment Southand has a natural hazards/risk assessment project underway.
Are other councils around New Zealand getting similar reports?
Yes – several councils have previously commissioned reports under CMIP5 modelling. Since the launch of CMIP6, ESNZ have done reports for Auckland and Greater Wellington Regional Councils and are about to do one for Environment Canterbury. Several other councils are also in the process of getting updated climate information. Every council has different needs and slightly different approaches.
A list of existing council reports can be found here.
What are the natural oscillations that influence our climate and weather?
There are three large-scale oscillations that influence climate and weather in New Zealand: El Niño-Southern Oscillation (ENSO) is a naturally occurring, periodic climate pattern in the tropical Pacific Ocean that significantly influences weather patterns worldwide. It involves alternating, irregular cycles (typically every 2–7 years) of sea surface temperatures, swinging between three phases: El Niño, La Niña, and Neutral. During El Niño, Southland, has lower seasonal temperatures and wetter than usual conditions. La Niña brings higher than normal temperatures to Southland (especially during summer) and drier conditions.
ENSO is highly likely to remain the dominant mode of natural climate variability in the 21st century and rainfall variability relating to ENSO is likely to increase. Over the next 50 to 100 years, there is evidence that the intensity of events may increase. There may be an increase in ‘extreme’ El Niño events which are associated with increased flood frequency and magnitude in Southland.
The other two oscillations are Southern Annular Mode and and Interdecadal Pacific Oscillation.


